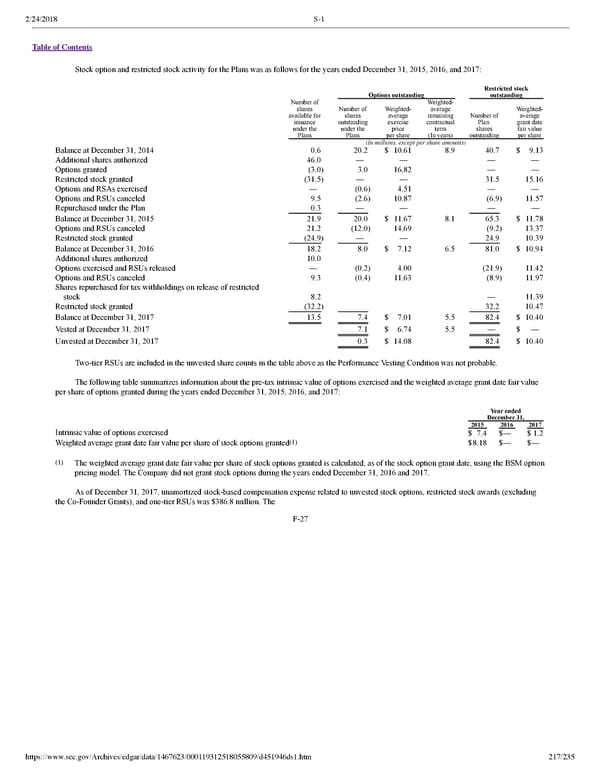
2/24/2018 S-1 Table of Contents Stock option and restricted stock activity for the Plans was as follows for the years ended December 31, 2015, 2016, and 2017: Restricted stock Options outstanding outstanding Number of Weighted shares Number of Weighted average Weighted available for shares average remaining Number of average issuance outstanding exercise contractual Plan grant date under the under the price term shares fair value Plans Plans per share (In years) outstanding per share (In millions, except per share amounts) Balance at December 31, 2014 0.6 20.2 $ 10.61 8.9 40.7 $ 9.13 Additional shares authorized 46.0 — — — — Options granted (3.0) 3.0 16.82 — — Restricted stock granted (31.5) — — 31.5 15.16 Options and RSAs exercised — (0.6) 4.51 — — Options and RSUs canceled 9.5 (2.6) 10.87 (6.9) 11.57 Repurchased under the Plan 0.3 — — — — Balance at December 31, 2015 21.9 20.0 $ 11.67 8.1 65.3 $ 11.78 Options and RSUs canceled 21.2 (12.0) 14.69 (9.2) 13.37 Restricted stock granted (24.9) — — 24.9 10.39 Balance at December 31, 2016 18.2 8.0 $ 7.12 6.5 81.0 $ 10.94 Additional shares authorized 10.0 Options exercised and RSUs released — (0.2) 4.00 (21.9) 11.42 Options and RSUs canceled 9.3 (0.4) 11.63 (8.9) 11.97 Shares repurchased for tax withholdings on release of restricted stock 8.2 — 11.39 Restricted stock granted (32.2) 32.2 10.47 Balance at December 31, 2017 13.5 7.4 $ 7.01 5.5 82.4 $ 10.40 Vested at December 31, 2017 7.1 $ 6.74 5.5 — $ — Unvested at December 31, 2017 0.3 $ 14.08 82.4 $ 10.40 Twotier RSUs are included in the unvested share counts in the table above as the Performance Vesting Condition was not probable. The following table summarizes information about the pretax intrinsic value of options exercised and the weighted average grant date fair value per share of options granted during the years ended December 31, 2015, 2016, and 2017: Year ended December 31, 2015 2016 2017 Intrinsic value of options exercised $ 7.4 $— $ 1.2 (1) Weighted average grant date fair value per share of stock options granted $8.18 $— $— (1) The weighted average grant date fair value per share of stock options granted is calculated, as of the stock option grant date, using the BSM option pricing model. The Company did not grant stock options during the years ended December 31, 2016 and 2017. As of December 31, 2017, unamortized stockbased compensation expense related to unvested stock options, restricted stock awards (excluding the CoFounder Grants), and onetier RSUs was $386.8 million. The F27 https://www.sec.gov/Archives/edgar/data/1467623/000119312518055809/d451946ds1.htm 217/235
 Dropbox S-1 | Interactive Prospectus Page 216 Page 218