
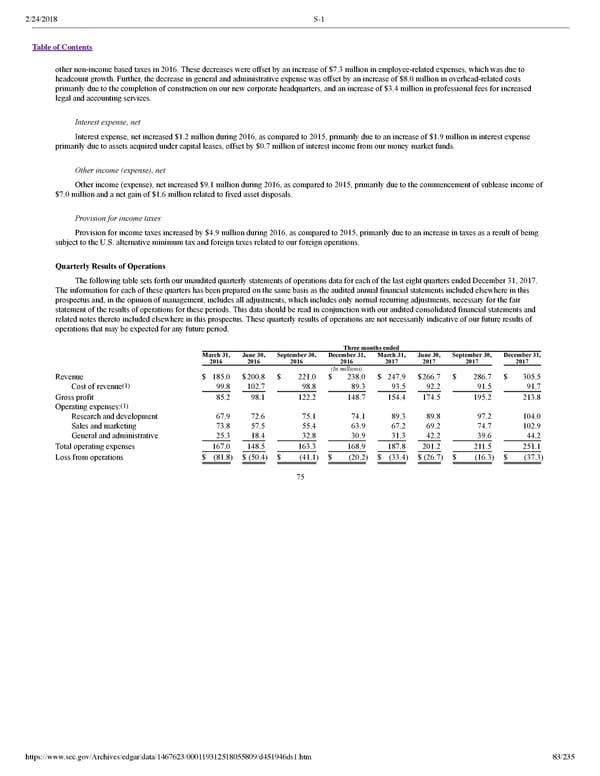
2/24/2018 S-1 Table of Contents other nonincome based taxes in 2016. These decreases were offset by an increase of $7.3 million in employeerelated expenses, which was due to headcount growth. Further, the decrease in general and administrative expense was offset by an increase of $8.0 million in overheadrelated costs primarily due to the completion of construction on our new corporate headquarters, and an increase of $3.4 million in professional fees for increased legal and accounting services. Interest expense, net Interest expense, net increased $1.2 million during 2016, as compared to 2015, primarily due to an increase of $1.9 million in interest expense primarily due to assets acquired under capital leases, offset by $0.7 million of interest income from our money market funds. Other income (expense), net Other income (expense), net increased $9.1 million during 2016, as compared to 2015, primarily due to the commencement of sublease income of $7.0 million and a net gain of $1.6 million related to fixed asset disposals. Provision for income taxes Provision for income taxes increased by $4.9 million during 2016, as compared to 2015, primarily due to an increase in taxes as a result of being subject to the U.S. alternative minimum tax and foreign taxes related to our foreign operations. Quarterly Results of Operations The following table sets forth our unaudited quarterly statements of operations data for each of the last eight quarters ended December 31, 2017. The information for each of these quarters has been prepared on the same basis as the audited annual financial statements included elsewhere in this prospectus and, in the opinion of management, includes all adjustments, which includes only normal recurring adjustments, necessary for the fair statement of the results of operations for these periods. This data should be read in conjunction with our audited consolidated financial statements and related notes thereto included elsewhere in this prospectus. These quarterly results of operations are not necessarily indicative of our future results of operations that may be expected for any future period. Three months ended March 31, June 30, September 30, December 31, March 31, June 30, September 30, December 31, 2016 2016 2016 2016 2017 2017 2017 2017 (In millions) Revenue $ 185.0 $200.8 $ 221.0 $ 238.0 $ 247.9 $266.7 $ 286.7 $ 305.5 (1) Cost of revenue 99.8 102.7 98.8 89.3 93.5 92.2 91.5 91.7 Gross profit 85.2 98.1 122.2 148.7 154.4 174.5 195.2 213.8 (1) Operating expenses: Research and development 67.9 72.6 75.1 74.1 89.3 89.8 97.2 104.0 Sales and marketing 73.8 57.5 55.4 63.9 67.2 69.2 74.7 102.9 General and administrative 25.3 18.4 32.8 30.9 31.3 42.2 39.6 44.2 Total operating expenses 167.0 148.5 163.3 168.9 187.8 201.2 211.5 251.1 Loss from operations $ (81.8) $ (50.4) $ (41.1) $ (20.2) $ (33.4) $ (26.7) $ (16.3) $ (37.3) 75 https://www.sec.gov/Archives/edgar/data/1467623/000119312518055809/d451946ds1.htm 83/235
 Dropbox S-1 | Interactive Prospectus Page 82 Page 84