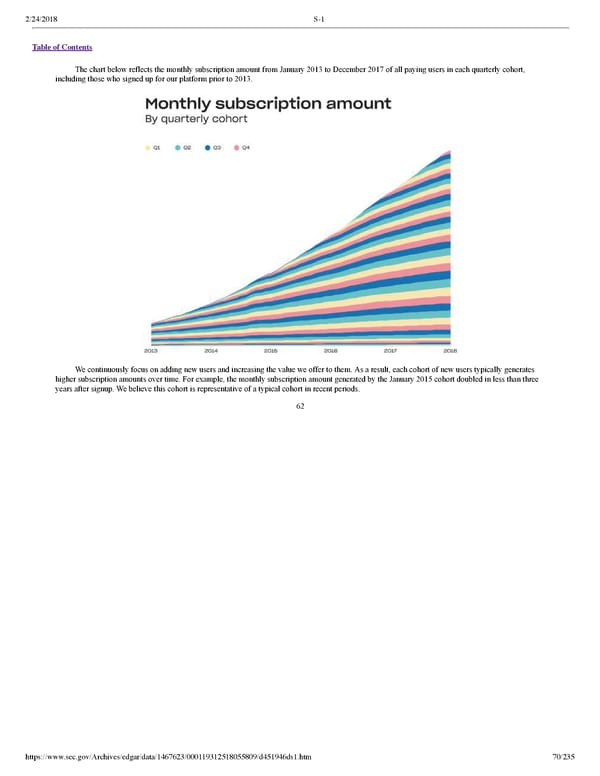
2/24/2018 S-1 Table of Contents The chart below reflects the monthly subscription amount from January 2013 to December 2017 of all paying users in each quarterly cohort, including those who signed up for our platform prior to 2013. We continuously focus on adding new users and increasing the value we offer to them. As a result, each cohort of new users typically generates higher subscription amounts over time. For example, the monthly subscription amount generated by the January 2015 cohort doubled in less than three years after signup. We believe this cohort is representative of a typical cohort in recent periods. 62 https://www.sec.gov/Archives/edgar/data/1467623/000119312518055809/d451946ds1.htm 70/235
 Dropbox S-1 | Interactive Prospectus Page 69 Page 71