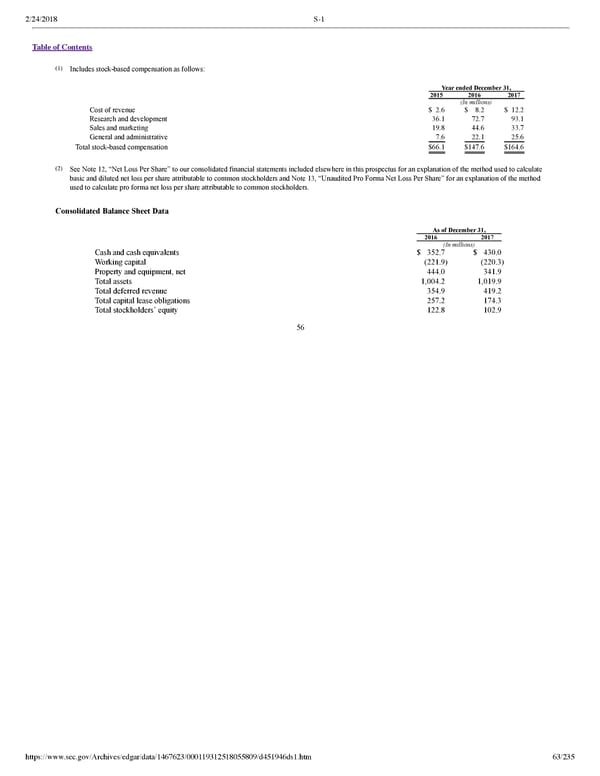
2/24/2018 S-1 Table of Contents (1) Includes stockbased compensation as follows: Year ended December 31, 2015 2016 2017 (In millions) Cost of revenue $ 2.6 $ 8.2 $ 12.2 Research and development 36.1 72.7 93.1 Sales and marketing 19.8 44.6 33.7 General and administrative 7.6 22.1 25.6 Total stockbased compensation $66.1 $147.6 $164.6 (2) See Note 12, “Net Loss Per Share” to our consolidated financial statements included elsewhere in this prospectus for an explanation of the method used to calculate basic and diluted net loss per share attributable to common stockholders and Note 13, “Unaudited Pro Forma Net Loss Per Share” for an explanation of the method used to calculate pro forma net loss per share attributable to common stockholders. Consolidated Balance Sheet Data As of December 31, 2016 2017 (In millions) Cash and cash equivalents $ 352.7 $ 430.0 Working capital (221.9) (220.3) Property and equipment, net 444.0 341.9 Total assets 1,004.2 1,019.9 Total deferred revenue 354.9 419.2 Total capital lease obligations 257.2 174.3 Total stockholders’ equity 122.8 102.9 56 https://www.sec.gov/Archives/edgar/data/1467623/000119312518055809/d451946ds1.htm 63/235
 Dropbox S-1 | Interactive Prospectus Page 62 Page 64