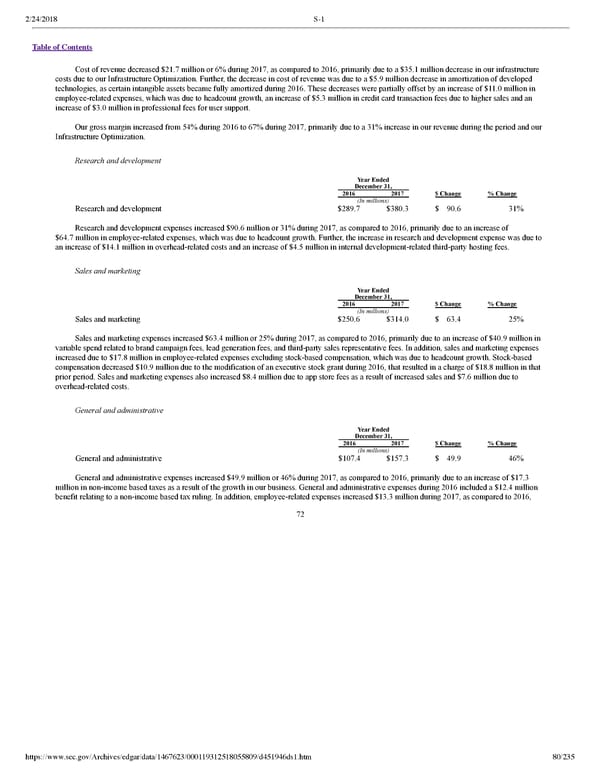
2/24/2018 S-1 Table of Contents Cost of revenue decreased $21.7 million or 6% during 2017, as compared to 2016, primarily due to a $35.1 million decrease in our infrastructure costs due to our Infrastructure Optimization. Further, the decrease in cost of revenue was due to a $5.9 million decrease in amortization of developed technologies, as certain intangible assets became fully amortized during 2016. These decreases were partially offset by an increase of $11.0 million in employeerelated expenses, which was due to headcount growth, an increase of $5.3 million in credit card transaction fees due to higher sales and an increase of $3.0 million in professional fees for user support. Our gross margin increased from 54% during 2016 to 67% during 2017, primarily due to a 31% increase in our revenue during the period and our Infrastructure Optimization. Research and development Year Ended December 31, 2016 2017 $ Change % Change (In millions) Research and development $289.7 $380.3 $ 90.6 31% Research and development expenses increased $90.6 million or 31% during 2017, as compared to 2016, primarily due to an increase of $64.7 million in employeerelated expenses, which was due to headcount growth. Further, the increase in research and development expense was due to an increase of $14.1 million in overheadrelated costs and an increase of $4.5 million in internal developmentrelated thirdparty hosting fees. Sales and marketing Year Ended December 31, 2016 2017 $ Change % Change (In millions) Sales and marketing $250.6 $314.0 $ 63.4 25% Sales and marketing expenses increased $63.4 million or 25% during 2017, as compared to 2016, primarily due to an increase of $40.9 million in variable spend related to brand campaign fees, lead generation fees, and thirdparty sales representative fees. In addition, sales and marketing expenses increased due to $17.8 million in employeerelated expenses excluding stockbased compensation, which was due to headcount growth. Stockbased compensation decreased $10.9 million due to the modification of an executive stock grant during 2016, that resulted in a charge of $18.8 million in that prior period. Sales and marketing expenses also increased $8.4 million due to app store fees as a result of increased sales and $7.6 million due to overheadrelated costs. General and administrative Year Ended December 31, 2016 2017 $ Change % Change (In millions) General and administrative $107.4 $157.3 $ 49.9 46% General and administrative expenses increased $49.9 million or 46% during 2017, as compared to 2016, primarily due to an increase of $17.3 million in nonincome based taxes as a result of the growth in our business. General and administrative expenses during 2016 included a $12.4 million benefit relating to a nonincome based tax ruling. In addition, employeerelated expenses increased $13.3 million during 2017, as compared to 2016, 72 https://www.sec.gov/Archives/edgar/data/1467623/000119312518055809/d451946ds1.htm 80/235
 Dropbox S-1 | Interactive Prospectus Page 79 Page 81