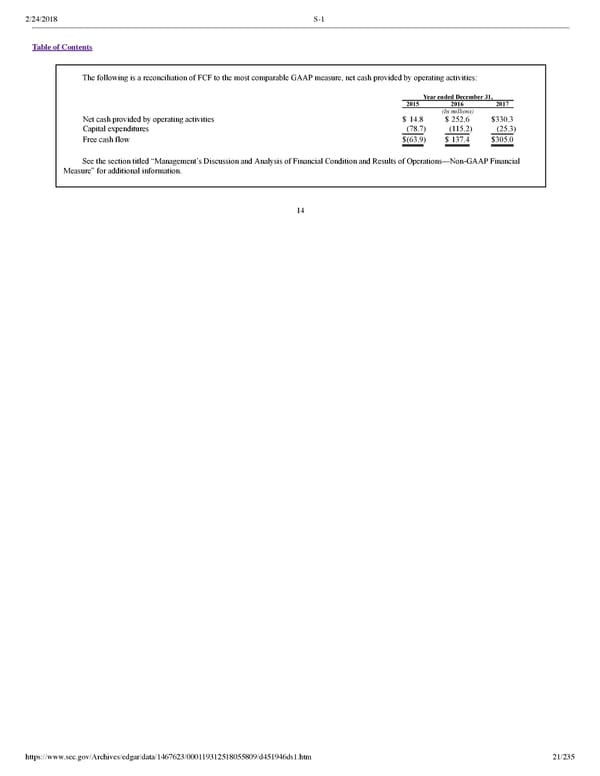
2/24/2018 S-1 Table of Contents The following is a reconciliation of FCF to the most comparable GAAP measure, net cash provided by operating activities: Year ended December 31, 2015 2016 2017 (In millions) Net cash provided by operating activities $ 14.8 $ 252.6 $330.3 Capital expenditures (78.7) (115.2) (25.3) Free cash flow $(63.9) $ 137.4 $305.0 See the section titled “Management’s Discussion and Analysis of Financial Condition and Results of Operations—NonGAAP Financial Measure” for additional information. 14 https://www.sec.gov/Archives/edgar/data/1467623/000119312518055809/d451946ds1.htm 21/235
 Dropbox S-1 | Interactive Prospectus Page 20 Page 22